If you run FlexLM (also branded FlexNet Publisher) license servers, sooner or later somebody asks you a usage question: who’s holding all the ABAQUS tokens?, do we actually use the 40 seats we renew every year?, why did checkouts fail yesterday afternoon? This guide walks through the practical answers — starting with what the vendor tools already give you for free, being clear about where they stop, and then standing up real monitoring in about ten minutes.
Everything here applies to any FlexLM-licensed application: Ansys, MATLAB, Cadence, Synopsys, Siemens NX, Autodesk network licenses, and a few hundred others.
Level zero: lmstat
FlexLM ships with lmutil, a multipurpose command-line tool, and its lmstat subcommand is the canonical way to ask a license server what’s happening right now:
lmutil lmstat -a -c 27000@licserver01
The -c argument takes the same port@host your client workstations use, and -a asks for everything. The output looks like this (trimmed):
lmgrd is UP, vendor daemon ansyslmd is UP
Users of cfd_solve_level1:  (Total of 25 licenses issued;  Total of 18 licenses in use)

  "cfd_solve_level1" v2024.1, vendor: ansyslmd
  jsmith wks-0214 (v2024.1) (licserver01/27000 1102), start Tue 6/10 8:42
  mgarcia wks-0307 (v2024.1) (licserver01/27000 2240), start Tue 6/10 9:15
  ...
That’s genuinely useful. You get daemon health, the seat count per feature, and a per-user line for every active checkout. For a quick “is the server up and who’s hogging the solver,” lmstat is the right tool and nothing beats its directness.
Two practical notes from the field:
lmutilis a Linux/Windows binary you get from your application vendor’s support portal (or it’s already sitting next tolmgrdon the license server). Use a reasonably current one; old versions can mis-parse newer server output.- On modern Linux distributions,
lmutiloften fails out of the box withNo such file or directorybecause it’s linked against the old LSB loader. The standard fix is a one-line symlink:sudo ln -s /lib64/ld-linux-x86-64.so.2 /lib64/ld-lsb-x86-64.so.3.
Where lmstat stops
lmstat answers exactly one question: what is checked out right now. The questions that end up mattering — at renewal time, in an audit, in a budget meeting — are all questions about time, and a point-in-time snapshot can’t touch them:
- No history. A snapshot at 11 a.m. on a Tuesday says nothing about peak usage last quarter. Renewal decisions need peak and sustained usage over months, not a screenshot.
- No denials. When the pool is exhausted,
lmstatshows 25 of 25 in use — it does not show the four engineers who got turned away. Denials live in the debug log, not in the live protocol. - One server at a time. Twelve license servers means twelve invocations and stitching the results together yourself — and FlexLM is rarely alone; most estates also run RLM, LM-X, or DSLS, each with its own incompatible CLI.
- No names you can take to a meeting. Features like
cfd_solve_level1mean something to the daemon, not to finance. Somebody has to map features to products, users to departments.
The classic next step is a cron job that runs lmstat -a every 15 minutes and parses the output into a database. That works — to a point. We’ve written about how the script approach plays out at length; the short version is that parsing, storage, dashboards, user mapping, and multi-vendor support each look small and add up to a part-time job nobody was hired for.
What FlexLM monitoring actually requires
Whatever tool you use — homegrown or purchased — continuous FlexLM monitoring is the same loop:
- Poll every server on a schedule with the vendor utility (the same data
lmstatshows). - Parse and store the snapshots in a database, normalized across servers and vendors.
- Aggregate into the views people actually ask for: usage over time, peaks, idle features, per-user and per-department breakdowns.
- Watch the servers themselves — a vendor daemon that’s down generates angry tickets faster than any utilization problem.
- Capture what polling can’t see by importing the server logs: short sessions and, critically, denials.
The rest of this guide sets that up with LiMon, our on-prem monitoring appliance. It does the loop above for FlexLM, RLM, LM-X, and DSLS in one place, on your hardware, with no agents on the license servers and nothing leaving your network.
Prerequisites
- A Linux host (VM is fine) with 2 GB RAM and 20 GB disk minimum.
- Network access from that host to each license server on its license port — for FlexLM typically
27000plus the vendor daemon port. Rule of thumb: the LiMon host needs the same access your users’ workstations have. - The
lmutilbinary for FlexLM (andrlmutil,lmxendutil, orDSLicSrvif you also run those vendors). LiMon queries servers through the official vendor utilities — the same ones you already trust — so you provide the binary from your vendor, and it goes in/opt/limon/tools/. Nothing is installed on the license servers themselves. - For Docker installs: Docker Engine
20.10+and Docker Composev2. For native packages: Python 3.9+ withvenvandpip, and a MariaDB10+or MySQL8.xdatabase.
Install: Docker, DEB, or RPM
All three packages are delivered through the customer portal — request a 60-day evaluation and the download instructions arrive by email. No credit card, and the evaluation runs with Professional features enabled.
Docker is the fastest self-contained path. The bundle ships its images inside the tarball — the installer does not pull from a public registry or fetch scripts from the internet, which matters on restricted networks:
tar -xzf limon-docker-<version>.tgz
cd limon-docker-<version>
./docker-install.sh
Debian/Ubuntu:
sudo apt install ./limon_<version>_amd64.deb
sudo limon-setup
RHEL/Rocky/Alma:
sudo dnf install ./limon-<version>.x86_64.rpm
sudo limon-setup
Native packages run LiMon as ordinary systemd services and include prebuilt offline wheels for Python 3.9, 3.11, and 3.12, so the Python layer installs without reaching PyPI on those versions.
Either path ends the same way: the installer prints the URL of the Setup Wizard.
Point it at your servers
The wizard walks through database, tool paths, and then the step that matters — Servers. Pick FlexLM as the type, enter the address in the same port@hostname format your license files use, and hit Test Connection to confirm the host can actually reach the daemon before you commit:
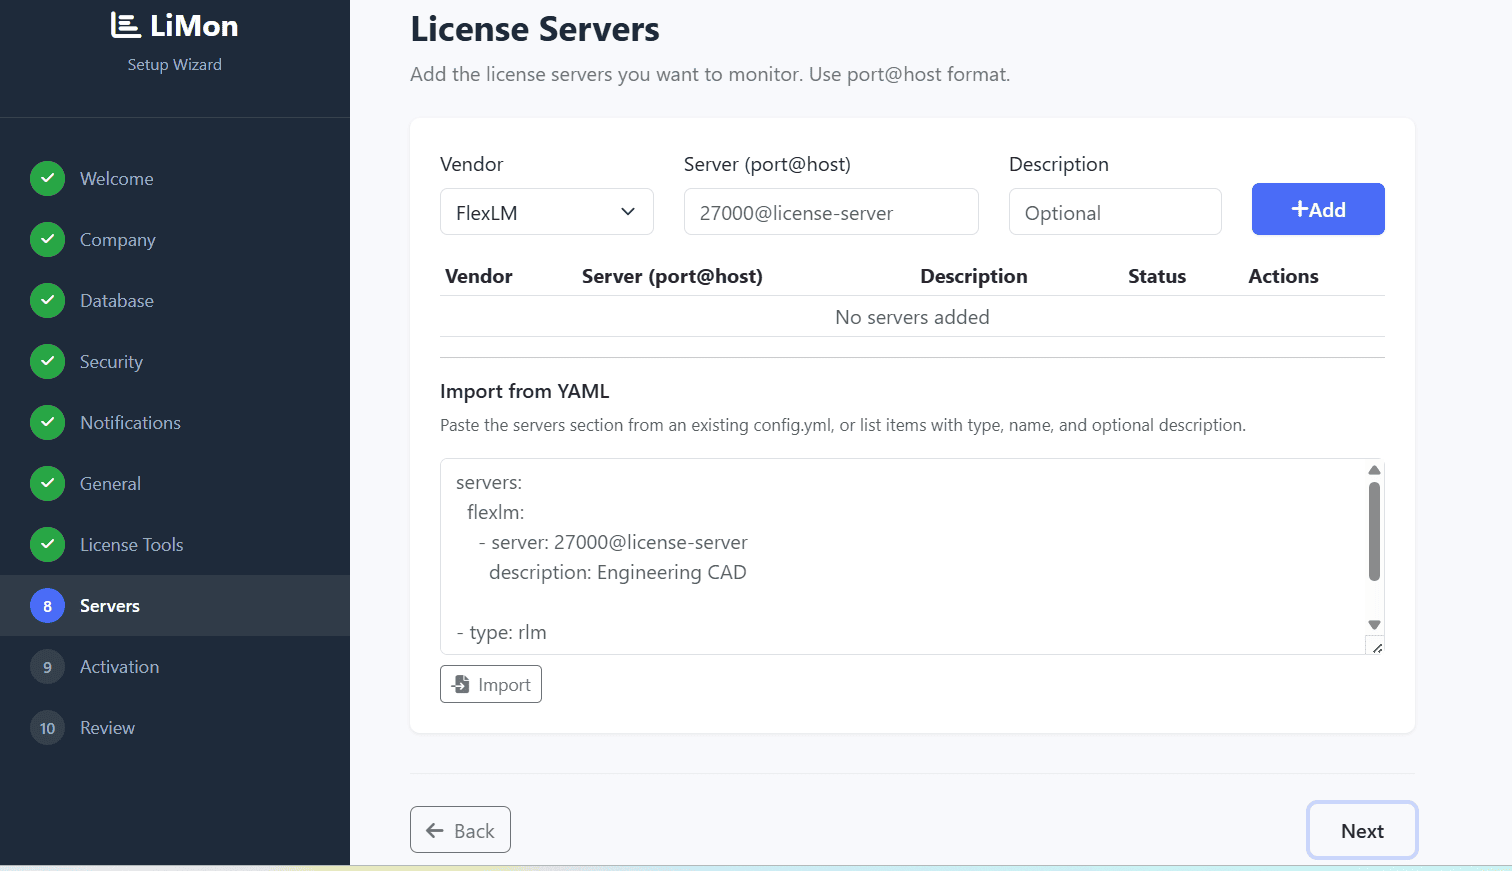
port@hostname, and a connection test before anything is saved.Add as many servers as you run — FlexLM and the other three vendor types side by side. Finish the wizard and LiMon begins polling immediately, every 10 minutes by default (tunable; the Live View shows real cycle times so you can tighten the interval from evidence rather than guesswork).
What you get back
Within a few polling cycles the dashboard is live: server and daemon health, current checkouts, utilization per feature — and from then on, every cycle becomes history:
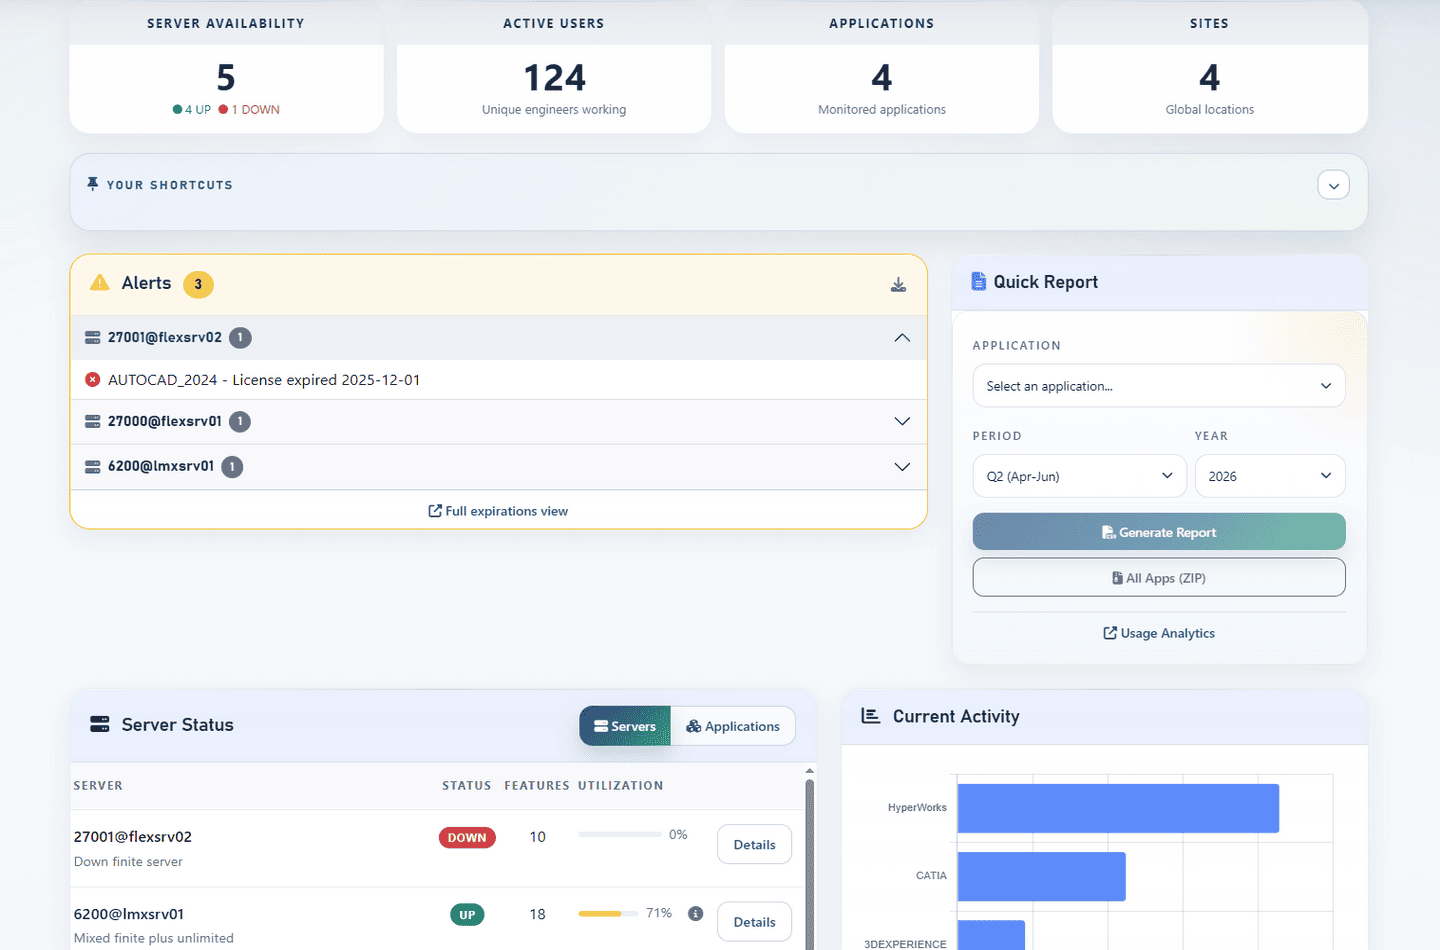
The data accumulates into the views that answer the questions lmstat couldn’t:
- Usage over time per feature, server, user, and department — peaks, sustained load, and idle features that quietly cost real money every renewal.
- Feature-to-application mapping, so reports speak in product names rather than daemon mnemonics, and AD/LDAP integration to turn raw usernames into people and departments.
- Search and inventory views across the whole estate, plus an automatic audit trail of every license change.
- Intelligence Reports — estate, application, site, savings, audit defense — as live web views and PDF/CSV exports, built for the renewal call and the audit response, not just for the ops room.
- Alerts by email (and Slack/Teams webhooks on Professional) when a server goes down or a feature crosses a threshold.
One honest caveat, because it’s the same one we flag for every polling-based tool including our own: polling samples the present. Checkouts that start and end between two polls are invisible to it, and denials never appear in the live protocol at all. That’s what log import is for — feed LiMon the FlexLM debug logs and it backfills short sessions and denial events into the same database. We’ve written a full guide on log import, including the FlexLM-specific traps (start lmgrd with -l +path or rotation will eat your history).
Notes for restricted environments
A lot of FlexLM estates live in places where “just send it to our cloud” is a non-answer: defense contractors, and any engineering or development environment where security policy keeps usage data inside the network. LiMon is built for that case rather than adapted to it:
- Runs entirely on-premises; nothing phones home. The only optional outbound calls are the Slack/Teams webhooks if you configure them.
- No agents on license servers or workstations — the poller queries over the network with the vendor’s own utilities.
- Air-gap friendly: Docker images ship in the bundle, native packages carry offline Python wheels, and after the initial download no internet access is required.
- The core polling engine and API are source-available (BUSL-1.1), so a security review can read what the software actually does.
Ten minutes, honestly
“Dashboard in ten minutes” is marketing arithmetic at most vendors, so to be precise about ours: the ten minutes is the installer plus the wizard, assuming the host exists, Docker (or the database) is in place, and the network path to your license servers is open. The part LiMon can’t speed up is your internal IT bureaucracy. Everything after the wizard — the history, the trends, the reports — accumulates on its own.
If you’d rather verify that against your own estate than take our word for it: request a 60-day evaluation, point it at a couple of FlexLM servers, and look at the data. The Standard and Professional platforms — 20 servers and unlimited, respectively — are priced on the page, one-time and perpetual, so you can do the budget math without a sales call.